
Our Blog
Wedge Pattern – Reversal and Continuation
3 Ways to trade the pattern
Wedge pattern are similar to triangle formation, which have two converging trendlines. There are basically two types of wedge pattern. The falling and the rising wedge, which can either occur in a uptrend or downtrend market. This leaves us with four variations of the wedge pattern.
What should be considered first is the overall market structure. Is price currently bullish or bearish?
A rising wedge is a reversal pattern in an uptrend and a continuation pattern in a downtrend. For the falling wedge the exact opposite is true. It is a reversal pattern in a downtrend and a continuation move in an uptrend.
Combining the wedge pattern with Elliott Waves
The wedge pattern can also easily be labelled with waves accordingly to the Elliott wave theory. A rising wedge for example can represents a leading diagonal as wave 1 or an ending diagonal as wave 5 in an impulse. So the next move will be either Wave 2 or wave A of a correction on degree higher. Both being countertrend moves and therefore a “reversal” of the preceding trend.
The continuation variation in an uptrend is the falling wedge. This pattern often occurs as wave 4 and has also 5 subwaves, which are labelled A-B-C-D-E and represents a triangle formation.
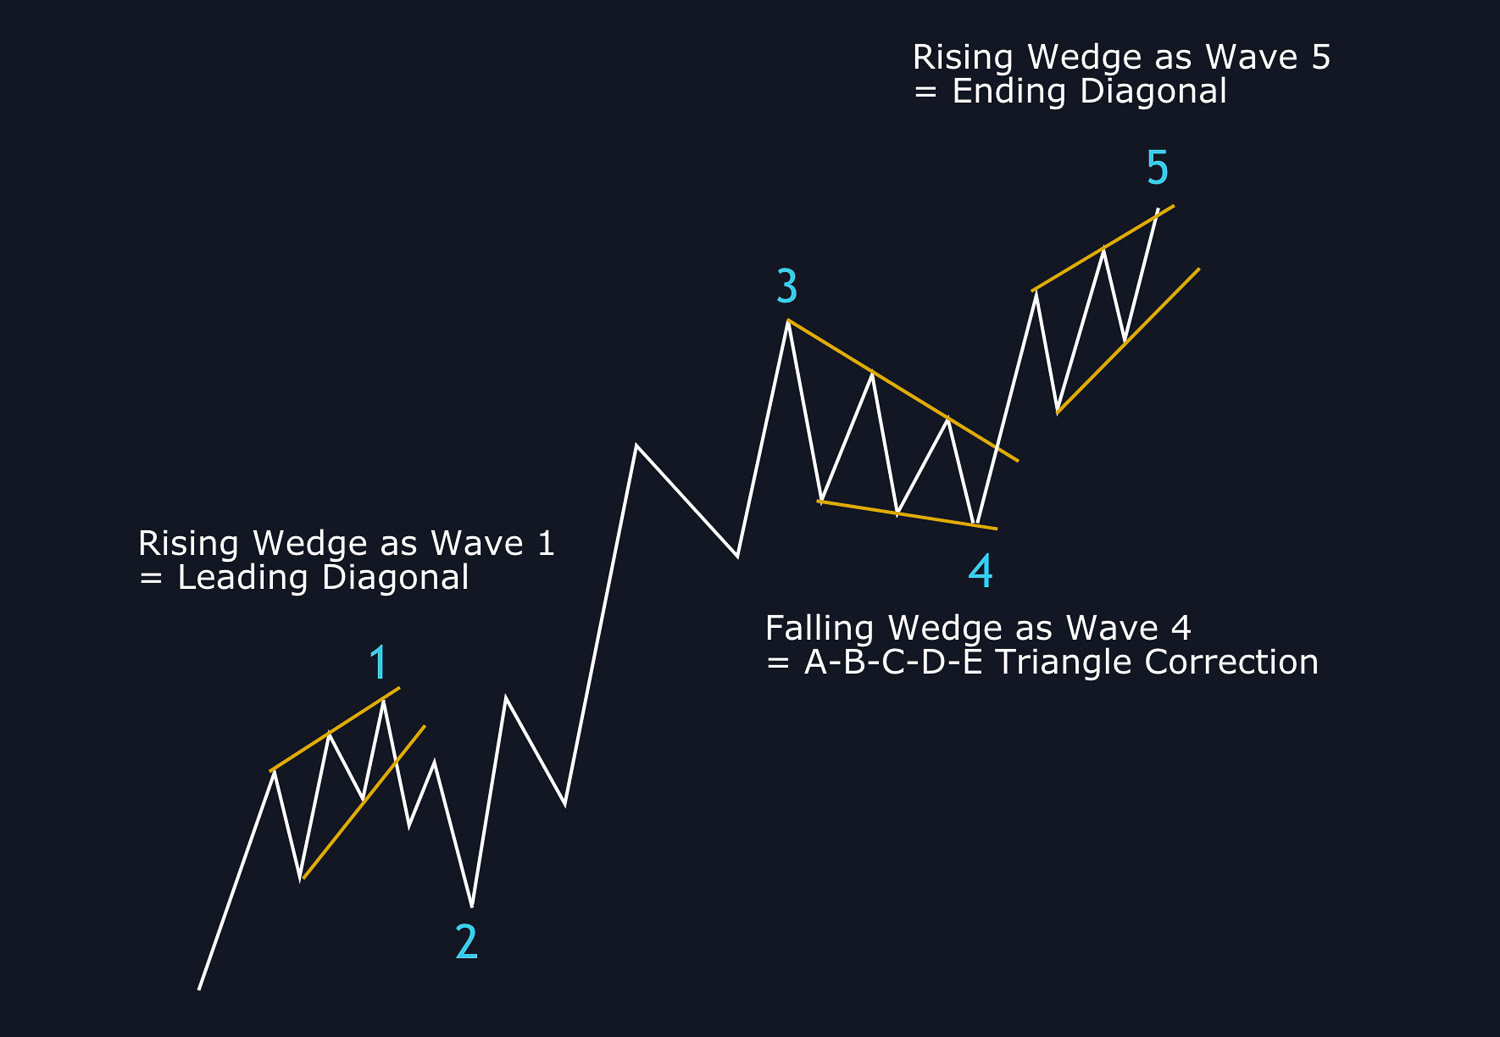
In an downtrend, the falling wedge is spotted at the end of overall movement and is then a ending diagonal. A strong signal, that the ongoing trend is over.
Basic Structure
In the next image you can see the basic textbook pattern of a rising wedge formation in an uptrend. It normally leads with a strong movement, making a higher high. After that, further higher highs and higher lows are formed, but the trendlines which connect the recent highs and recent lows are contracting. Price is squeezing.

When taking the traders who are trading the uptrend into account, you have to consider, that they are rising their stops under the recent lows. This means, that short orders are located there to even out their long position.
The uptrend starts to lose its momentum, because the recent higher highs are not greater than the rising lows. As soon as enough market participants decide the uptrend isn’t worth participating anymore and take profit, they are starting a cascade of sell order. This leads to rapid movements often resulting in huge falls without any major correction.
3 Ways to trade a rising wedge
- classic approach: Clear impulsive close under the lower rising trendline
- retest variation: In some cases the price retest the lower trendline
- Upper trendline touch: Looking for clear sell signal near the upper trendline
Classic approach
This is the save heaven method of trading a rising wedge pattern. As you can see in the next chart, a sell order will be opened as soon as a clear impulsive close in your timeframe is given. The placement of the SL could be above the recent high, but this often results in a rather big SL. Another method to place your stop and manage your trade will be discussed in a more detailed article about advanced trade management.
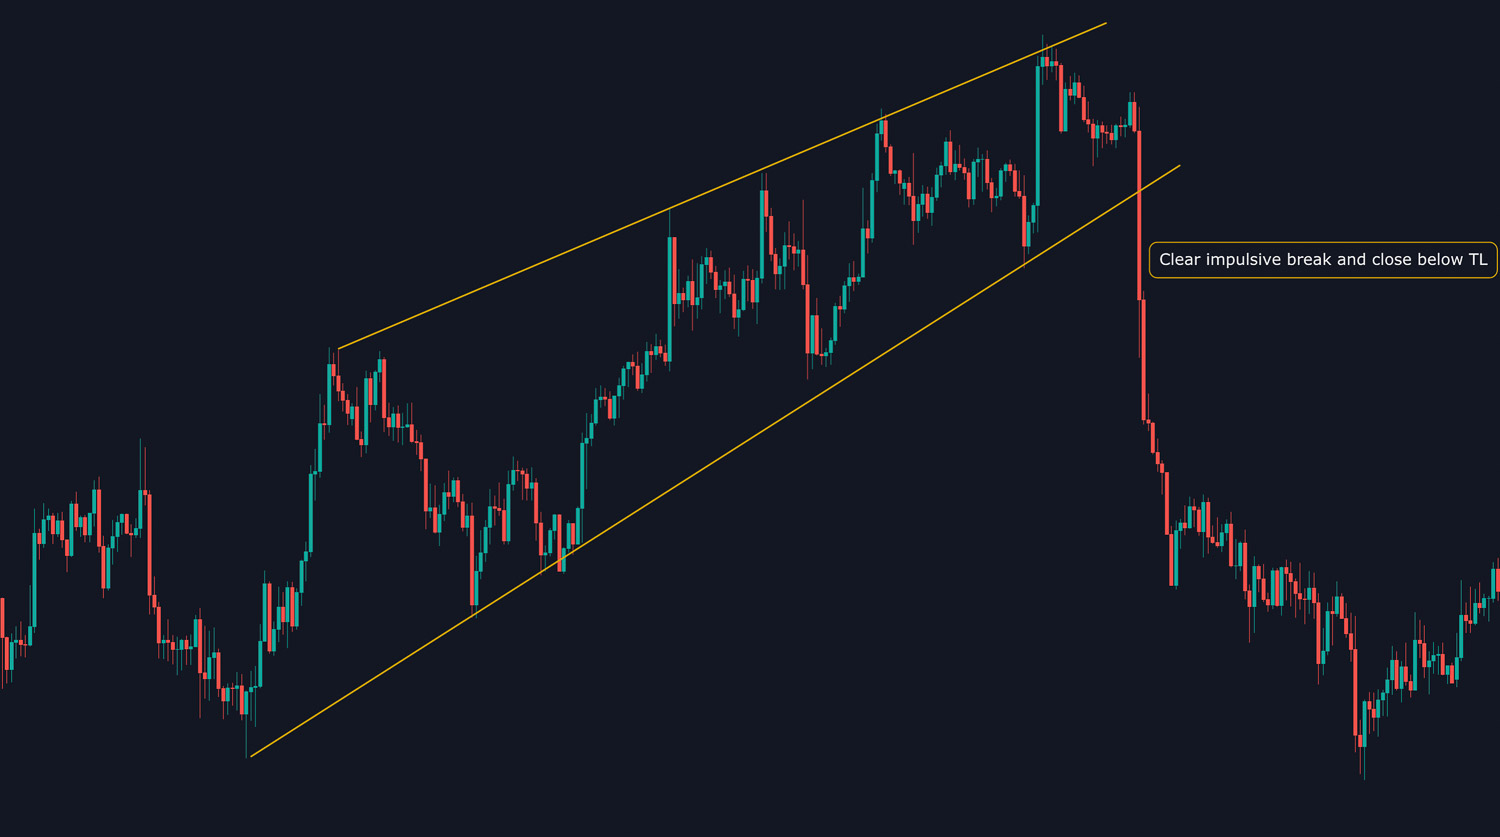
There is nothing wrong trading a rising wedge with a classic approach. It gives you a decent risk to reward ratio (R:R) and the chance of failing is relatively low. But everybody today knows how most traders are acting on a rising wedge and the smart money will try to kick you out of your position.
Retest Variation
Another classic in the book is the typical retest of the lower trendline. It can happen in two ways, one being a fast retest and impulsive rejection. The other is a more corrective retest, often resulting in two or more retouches.
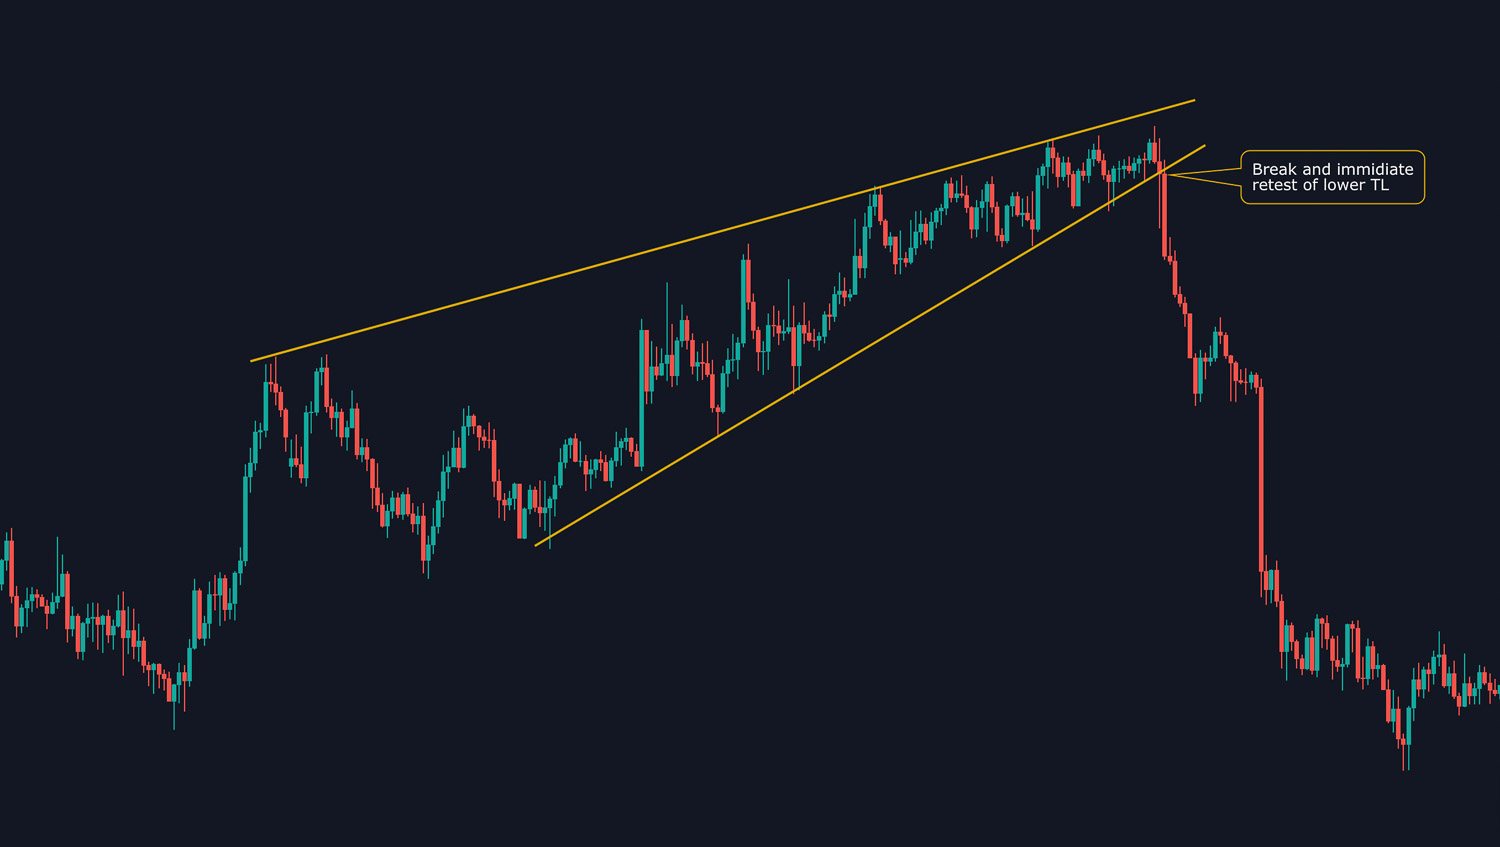
The advantage with a retest is, that it gives you further confirmation, as long as there is another sell signal. It also gives you a smaller SL, because you place your stop above the recent sell signal and not above the previous high (which is also possible).
Upper trendline touch
This one is my favorite way of trading a rising wedge pattern. I noticed over time, that it is the most reliable variation, resulting in little to no loss trades. Because you enter the market at the top of the structure, a move to the downside happens pretty much every time, even when the overall wedge is not broken.
When trading this way, I am looking for a sell signal at the top of the wedge, near the upper trendline. I know from experience, that the wedge is most likely to break to the downside, it is just a matter of time. Therefore you just have to look for a nice price action sell signal and execute your trade.
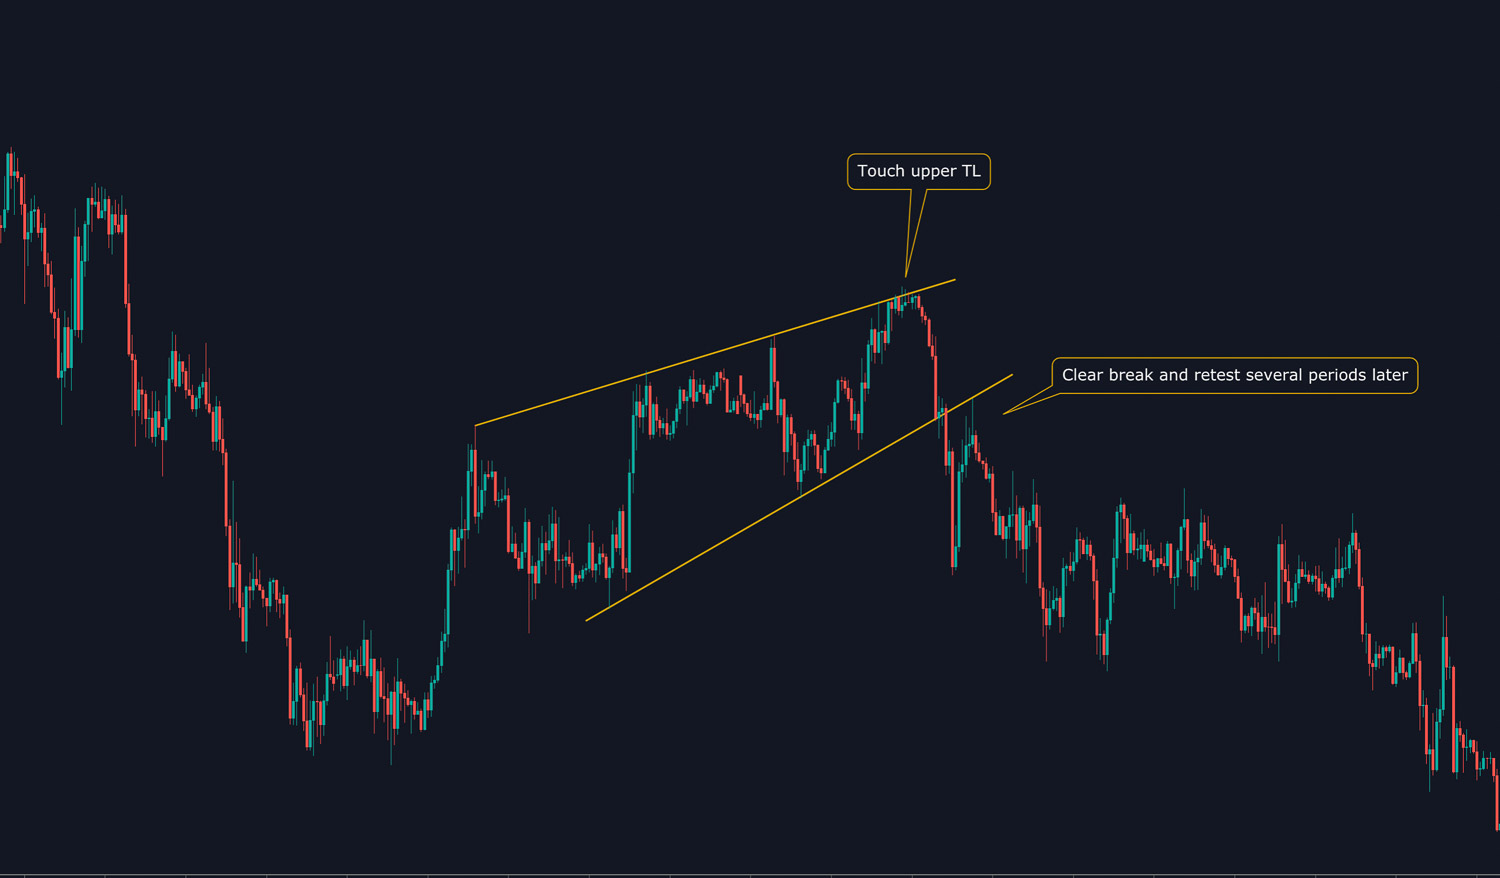
If the first trade was not successful you have to wait patiently to get another signal and enter your trade without hesitation. Do not enter blindly because of Fear of Missing Out (FOMO).
Special characteristics - Fakeout upper trendline
Another thing to consider when trading a wedge is a fake breakout aka Fakeout. I got a more detailed article about this pattern in my post about powerful price action signals.
I only look for a fake breakout at the top of the structure. When waiting for a strong clear price action signal, you should always have in mind the possibility of price breaking to the upside. This does happen quite often, but only on rare occasion the breakout is sustainable. In most cases the breakout represents the last push of price to the upside before a huge fall takes place.
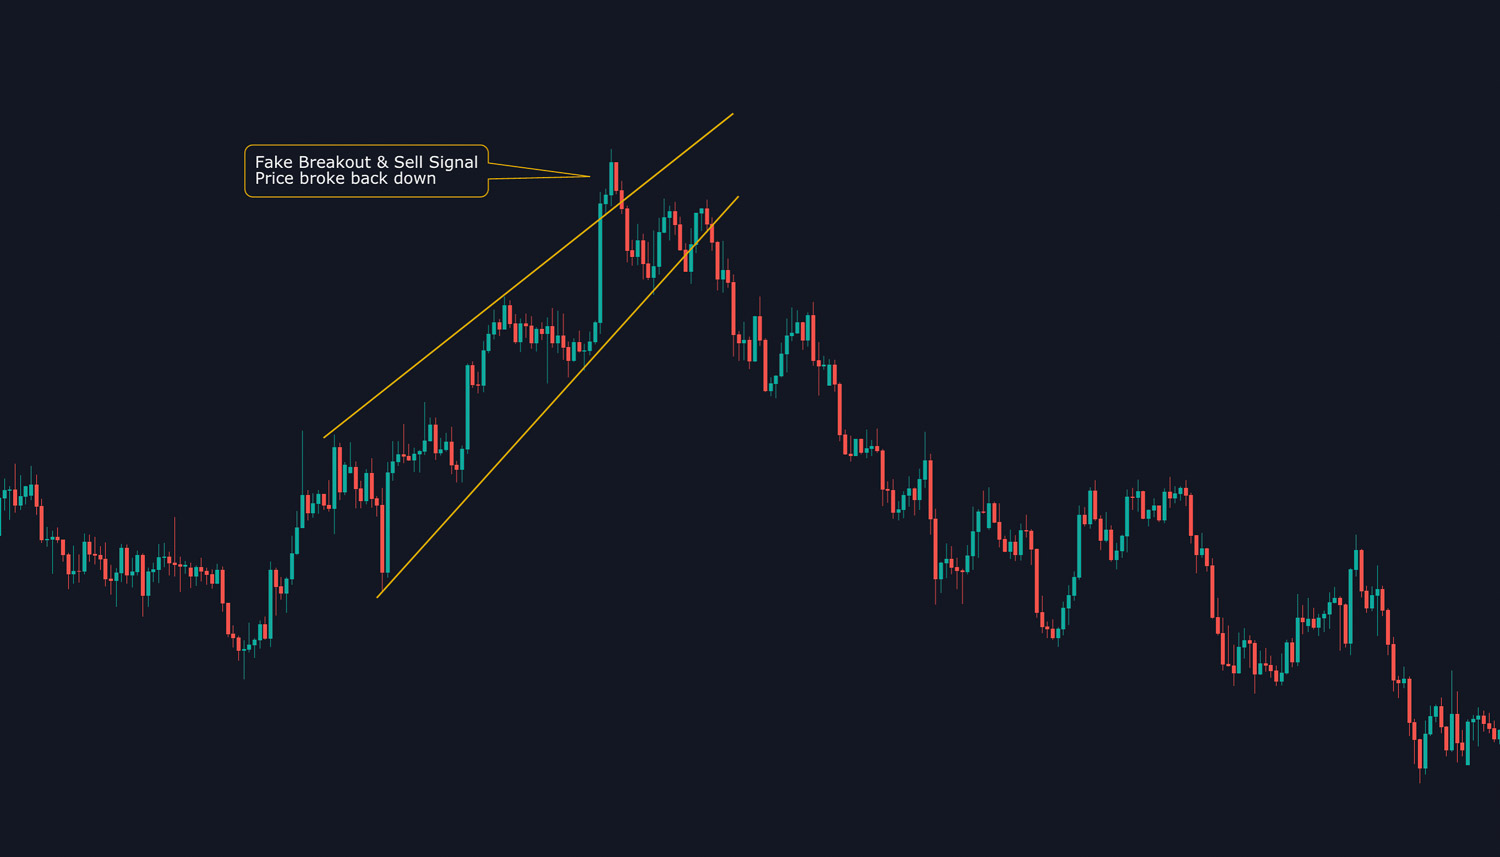
This is where you want to be alert and calm and the same time. Just watch how the price reacts and be open-minded. Does a price action signal occur? A nice candlestick formation or a break of the trend on a lower timeframe? If so, place a trade with a reasonable SL. Do not put your stop to close, because sometimes a minor higher high takes place.
Looking for pattern – Experience
First you should always identify the overall market structure. After that it is time to have a closer look at the chart and look for pattern. This does not happen overnight. You need experience to spot these pattern in the market. After some time, you will see them everywhere and realize, that the market repeats itself. This will lead to the conclusion, that there is no need to rush anything. Give yourself the time to take advantage of the abundance of trading opportunities and the profit will come.
Conclusion
Rising wedges are a classic price action pattern which repeats itself quite often in the markets. There are different ways to trade this pattern, all of them offering a good to great R:R. A key skill to acquire when trading any pattern is to stay open-minded to the price and what the candles are telling you. Be patient and be aware of your emotions. Do not let FOMO overrule your judgement. There are unlimited opportunities in the markets just waiting to be taken advantage of.