
Our Blog
Price Action Reversal Pattern
Double Top/Double Bottom:
A double top or bottom is a very powerful chart pattern. It tells us, that the market was not able to break the support or resistance zone. It also tells us, that supply or demand was big enough to drive price away from the zone. As you can read in my article about horizontal support and resistance, it is more of a zone or area where a double top occurs, then an exact line it has to touch to be valid.
Double tops or bottoms happen pretty often on smaller timeframes like the 1h or 4h chart, but are rather rare on the higher timeframe. Therefore they are even more powerful. As you can see in the following chart, we have a double top on the weekly and daily chart, depending on how much you zoom in.
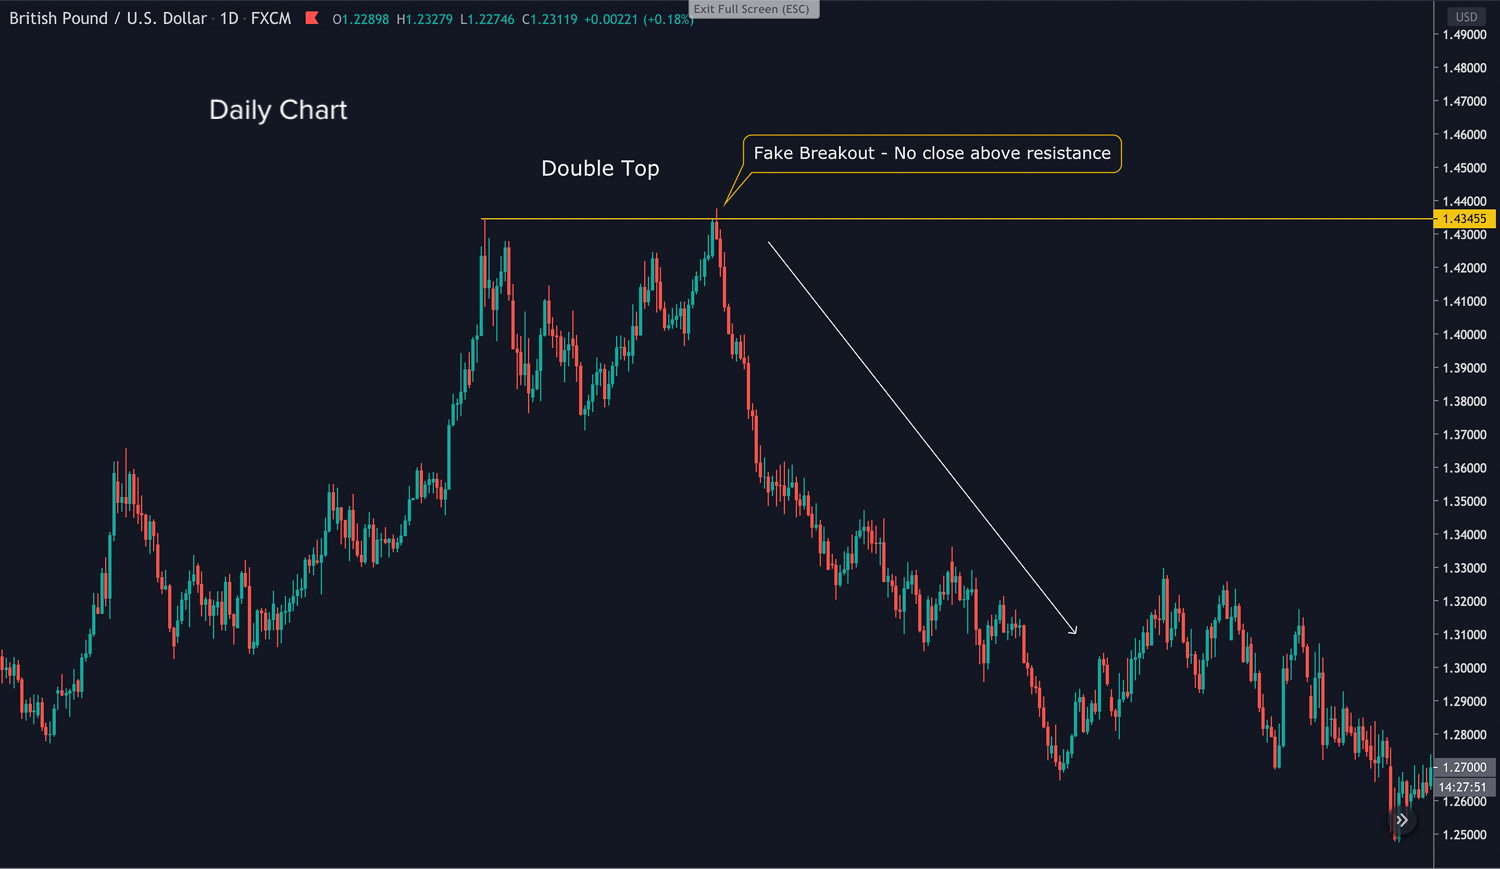
After the price was rejected at the resistance, the market was strongly sold and the pound lost against the dollar for the next year. The movement was pretty strong and no real pullback happened for several weeks. For this reason it would have been a really good trade and a lot of people took great profit, making enough for a month or a year.
Fake breakout – Catching the amateur on the wrong side
If you have a close look at the chart again you will also notice, that the market broke the last high in intraday for quite some pips. This move tricked the average retail daytrader into believing, that the high was broken and the trend continued. Therefore catching them on the wrong side of the market before the huge move happened.
This kind of movement, a so called fake breakout or Fakeout happens a good deal of the time on the bigger timeframe. As stated above, we are looking for areas of supply or demand and not an exact line. The daily chart made a nice sell Pinbar, in other words a powerful candlestick pattern.
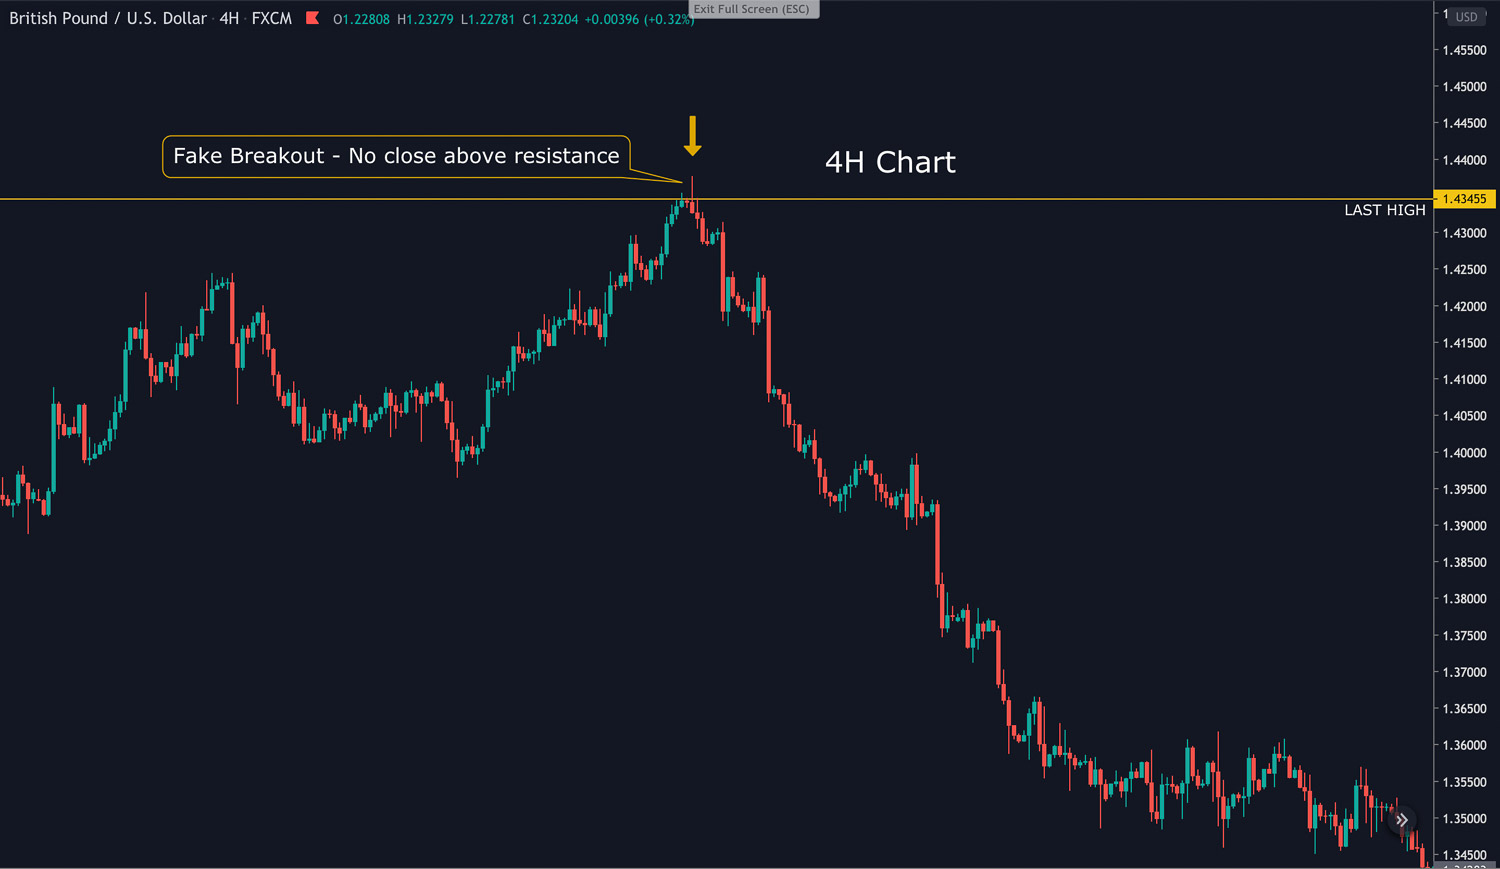
Lower timeframe – Entry signal
When switching to a lower timeframe, like the 4h chart, we can also see a picture perfect pinbar. This gives us the first clue, that the breakout might not be sustainable. It is important to notice, that this Pinbar had its close inside the last high.
This evidence alone was enough to take this trade, because above all the big picture of the overall market structure perfectly lined up with the price action. After the daily close it was crystal clear. That this trade was indeed a perfect setup and a significant move to the downside could be expected.
This signal gave us a really good Risk to Reward Ratio (R:R), an aspect that is critical for successful trading forex or any other market.
Do you want to receive your weekly mini lessons?
Just enter your email and get
regular updates and Trade Ideas!
Double Top/Bottom on smaller timeframes
In the last section we talked about the higher timeframe and the powerful impact a double top or bottom has for the long term trend.
Due to the fact, that they are pretty rare on the daily or weekly chart, not many trading opportunities are given. Nevertheless you can also use this chart pattern on the smaller timeframe like the 1h or 4h. They may not lead to a movement for the next weeks or months, but we can achieve great R:R due to the smaller SL.
Placing your trade
Have a look at the next video. First, we identify key areas where a strong support or resistance is visible and a significant move might occur. Then we sit patiently on our hands and watch how the price reacts at this level. Do we get a price action signal?
It is important to wait for a clear signal. Fear of missing out (FOMO) will urge you to jumo into a trade even when no clear signal is given.
After the candlestick signal came about and our edge in the market is present, we place our trade and our stop loss. Time to do something else and not mess around with our trade. This is where a lot of new traders have their difficulties.
You have to give the market time to play out and show you if your idea was right or not. After all trading is a game of probabilities. You do not have to be right all the time to make money. Consider this quote of Paul Tudor Jones, one of the greatest trader of all time:
“[I’m looking for] 5:1 (risk /reward). Five to one means I’m risking one dollar to make five. What five to one does is allow you to have a hit ratio of 20%. I can actually be a complete imbecile. I can be wrong 80% of the time, and I’m still not going to lose.”
- Paul Tudor Jones
Where could a movement occur?
When taking a trade you should always consider the other market participants. Especially the smart money, the professionals in the market. Think about where a strong move could happen. Price only forms from orders and hence it is important where somebody might take profit, open, close or add to a position.
Even multiple actions like reversing a position, resulting in double the size of buy or sell contracts happen all the time. But don’t forget the traders who are currently flat. The have currently no position, but are willing to open one, if the market gives them a signal.
Conclusion
Trading the double top /double bottom pattern is a very powerful strategy and a should be in your basic signals you are watching out for in the market. They are rare on the higher timeframe, but happen pretty often on smaller timeframes.
Wait for a clear entry signal before entering a trade and don’t get swept away by the emotion of FOMO.
Always consider a Fakeout when looking for a double top and place your stop accordingly. Think about Paul Tudor Jones and play the game of trading like a professional and you will reach your financial freedom.