
Our Blog
Price Action Trading – A Beginners Guide
What is price action trading and how is it different from other kinds of trading?
Price action trading is a practice of trading with a clean chart. It is called price action because your only guidance is the price written on the chart. No indicators like moving averages, RSI, MACD or Ichimoku clouds are used.
Price Action Trading has its origin in the Dow Theory which was introduced by Charles H. Dow. The theory says, that the market moves in phases, which can be best described as trends. These trends consist of different waves which form a market cycle. There are fast movements and corrections which represent the profit taking and allocation of positions.
The biggest advantage of price action trading is, that the trader only has to focus on the price, nothing else. No crossovers of moving averages, divergences or oversold indications are necessary. Don’t get me wrong, it is possible to earn money in the market with all these techniques, but it is rather difficult and often leads to over-complication of the actual thing. Especially beginners are often unable to cope with different signals given by the various indicators.
Have a quick look at a messy chart full of indicators versus a clean chart, only displaying the price movement through candles.[
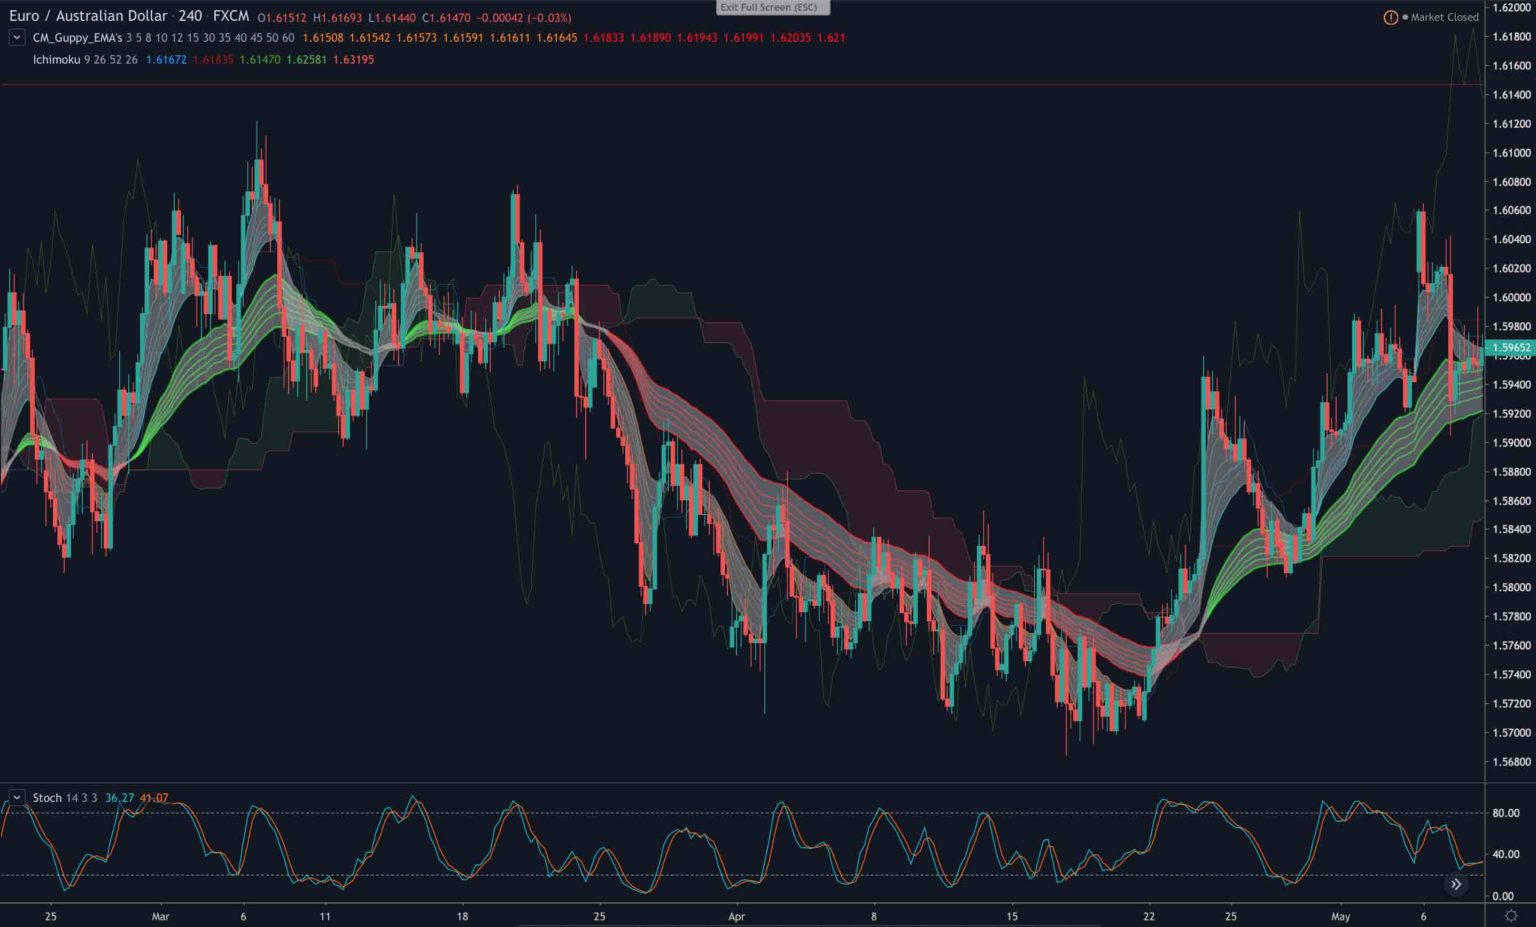

I made the experience, that the chart reflect the traders mind. So if your chart is all messy, full of indicators and a lot of drawings, you lack clarity in your mind and your trading decisions. Keep your charts clean to have a clear view of the market.
Learn to read the market – Trend & Correction
As you can see in the picture below, the market does not behave the same all the time. There are phases where you can see fast movements, mostly with no real retrace. And there are phases where the price chart looks messy and no clear direction is obvious. The fast moves are often called impulsive phases (which comes from Elliott Theory) and your job is to identify these to see in which phase the market is right now.
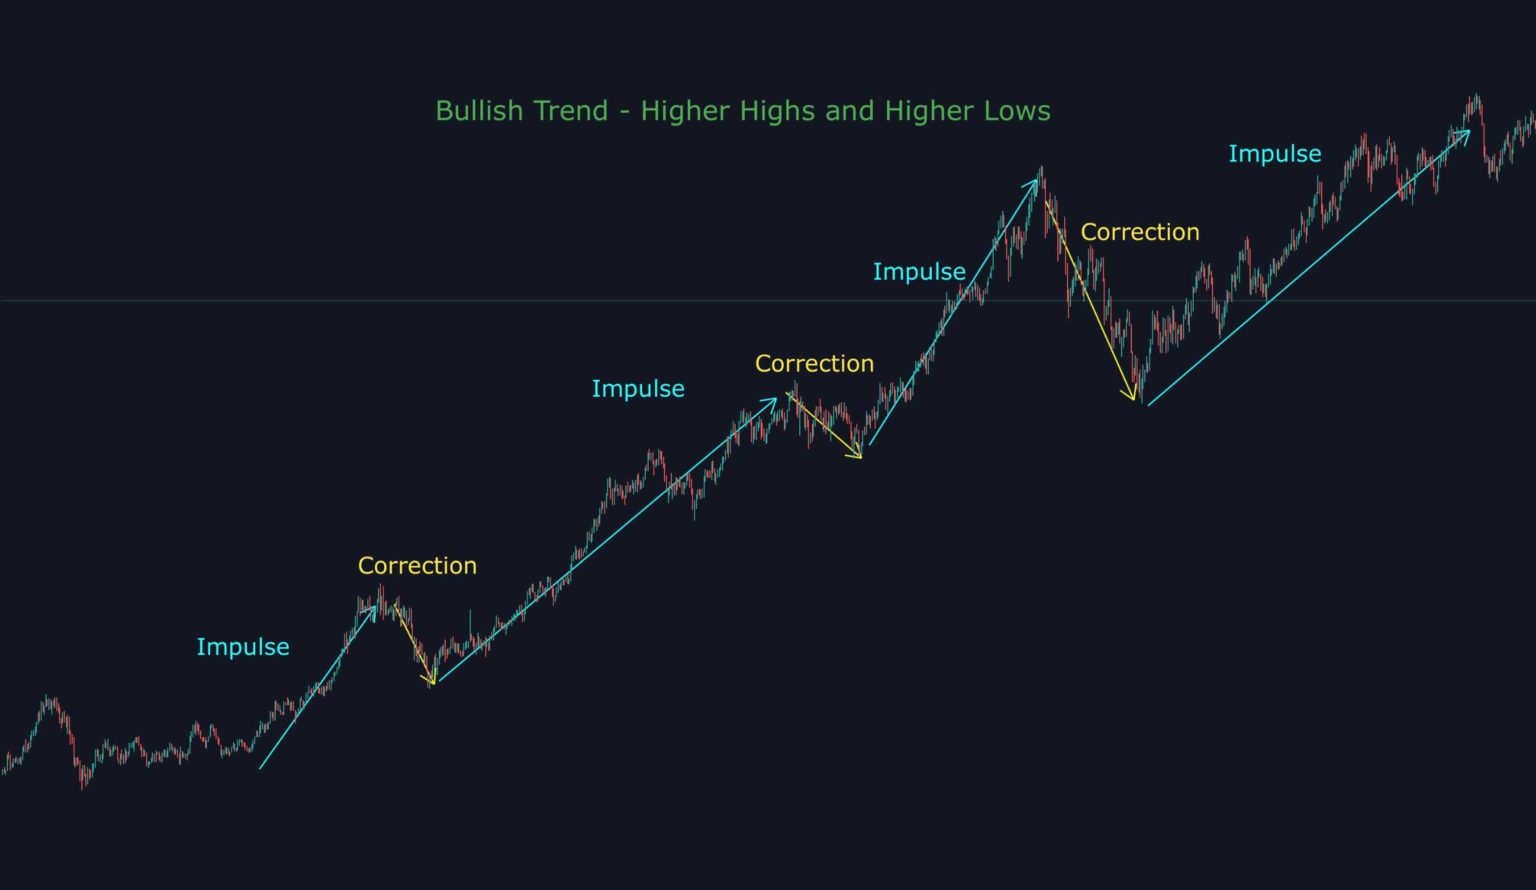
After a fast and strong move in the market, it begins to retrace and start forming the correction. The correction happens when market participants, usually the smart money, start to take profit and close their positions.
Consider an Uptrend: For every long contract they are in they have to take a short position to even out their overall position. This results in less buying interest and more interest in sell contracts. When there is less buying interest in the market, prices start to fall.
Do you want to receive your weekly mini lessons?
Just enter your email and get
regular updates and Trade Ideas!
Respect the market behaviour
Usually corrections don’t happen fast, they are longer than the impulsive phase and not so clean. But there are exceptions to the rule. Sometimes the correction occurs really fast, before the primary trend continues.
Your goal is, to get in the market when a strong movement is expected and the trend continues. Who doesn’t like a fast profit without major retracements and a quickly hit profit target?
Different timeframes – Trend within a Trend
When talking about trends it is important to consider the timeframe. A value investor, whose time horizon is long term, might say the market is still in an uptrend, while a swing or day trader already identified a downward trend.
Have a look at the next picture and you will see, that there are trends within trends. A correction which takes several days or weeks often has nice impulsive phases, which can give good trading opportunities. Or you can have a nice 1 hour trend which persist over several session, but only representing the correction of the larger trend. The trader who is open-minded to the market can read these signs and make profit in both situations.
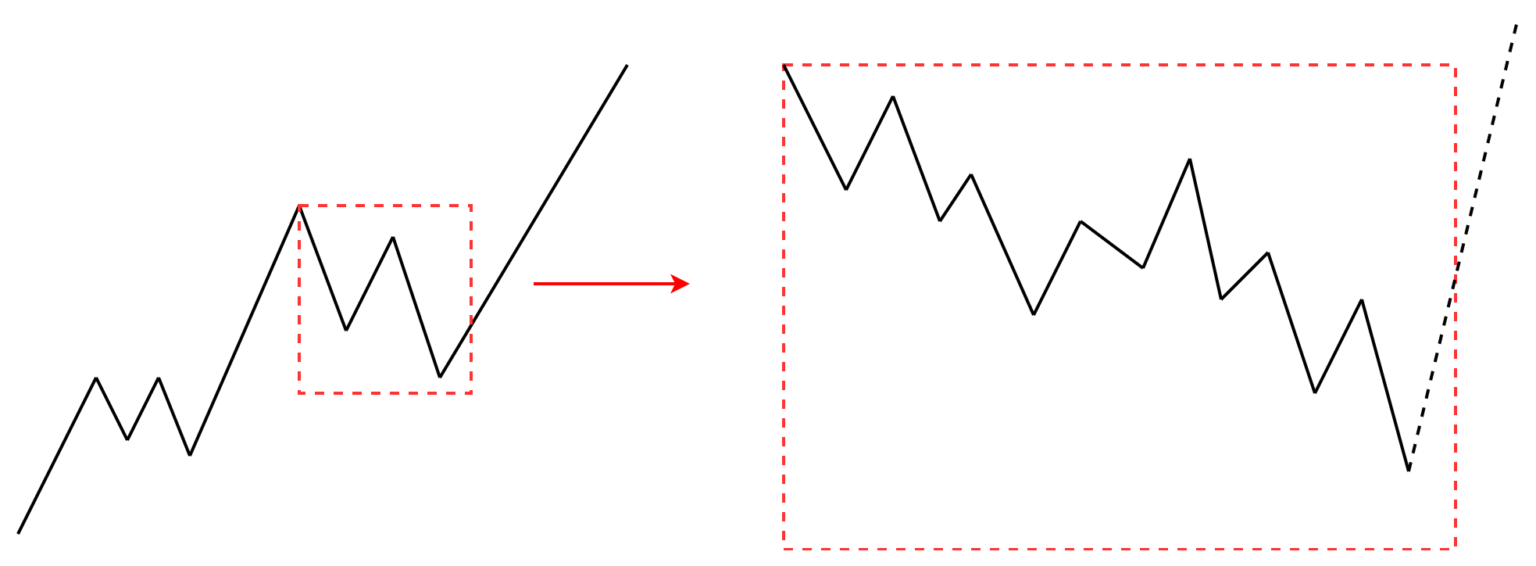
Trends within trends happen across all timeframes, but not all are good trading opportunities. Going too low on the timeframe reduces your chance of a winning trade.
In general it’s best to trade with the trend, because the internal struggle of retracements and decreasing profits does not happen.
Ways to trade the trend with price action signals
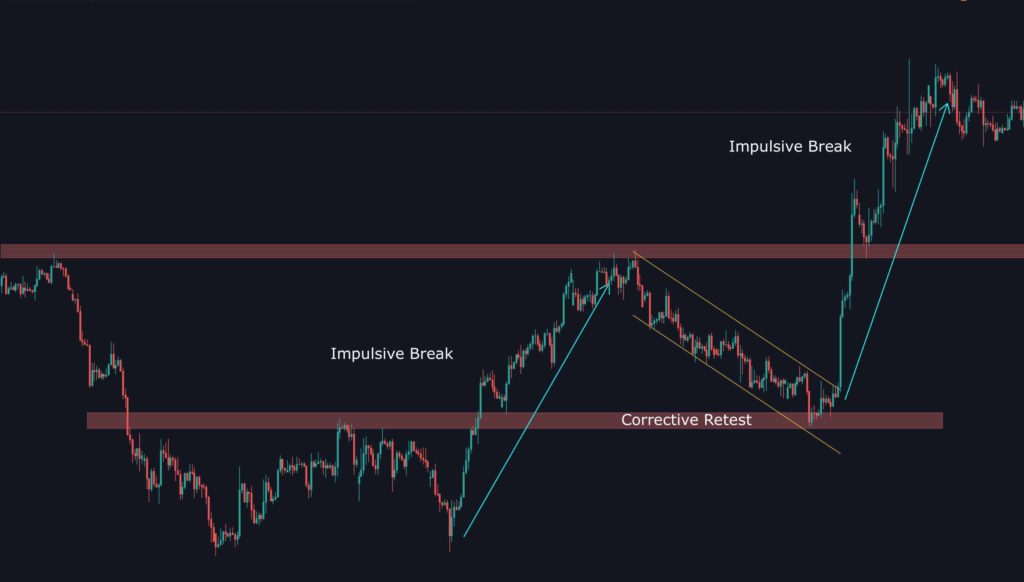
There are many ways to identify a trading opportunity in the market. One is to draw support and resistance areas, from where the correction is ending and the trend continues.
As seen in the chart below, there is a clear impulsive phase. Follow by a consolidation of price, returning to a value area, where new buying interest comes into the market. After the price rejected this area, it continues to rise again in an impulsive move.
This is where you want to consider opening a trade. Keeping in mind, that the price at all times reflects the beliefs of the market participants and if enough people think it is cheap, they will buy and price starts to rise again.
Basic Price Action Signals
When trading with price action and you have identified the overall market structure, you need a good and reliable entry signal to actually place a trade. Have a look at my article about powerful price action signals.
Candlestick pattern like Pinbars, Engulfing bars or Fakeout are often a clear indicator, that the market is turning and the correction is ending.
Conclusion:
Focusing on the price, which at all times reflects the beliefs of all active market participants, is the only tool you need. But don’t forget the trader who are currently flat, meaning they have no position. Keep your charts clean, so you can have clarity in your mind. Always try to identify the current market phase and ask yourself: Where could a movement occur? – Be ready to act on the opportunity when it presents itself.