
Our Blog
Powerful Price Action Signals
When talking about trading the financial markets it is not enough to make a good analysis. At some point you have to execute a trade. This article is about powerful price action signals and how they can be used to improve your trading results. I will also cover why the overall market phase is important and what pitfalls to avoid.
But first let’s start with why I use candlestick charts and you should too. A candle gives us information about the open, high, low and close price of a given period. So when looking at a daily candle all the price movement and therefore information we need can be received from looking at it and understand the underlying meaning. Candlestick pattern can consist of one candle or a number of candles.
Pinbar – Your swiss army knife of candlestick pattern
When looking at a Pinbar pattern we can see that is has a long tail in comparison with the body. The close should be at least as high as the open price for a bullish candle or below the open price for a bearish candle. Normally a good Pinbar has a wick, which is 2-3 times the size of the body.
What a (bullish) Pinbar represents is, that price dropped below the open price in this period (e.g. 1 Day) quite quickly. After this strong move, the market was exhausted and was bought back up. This move indicated, that the price might move higher in the future. Because the buyers bought with the intention that the future price will be higher and they can sell with a profit. They expressed their beliefs onto the market.
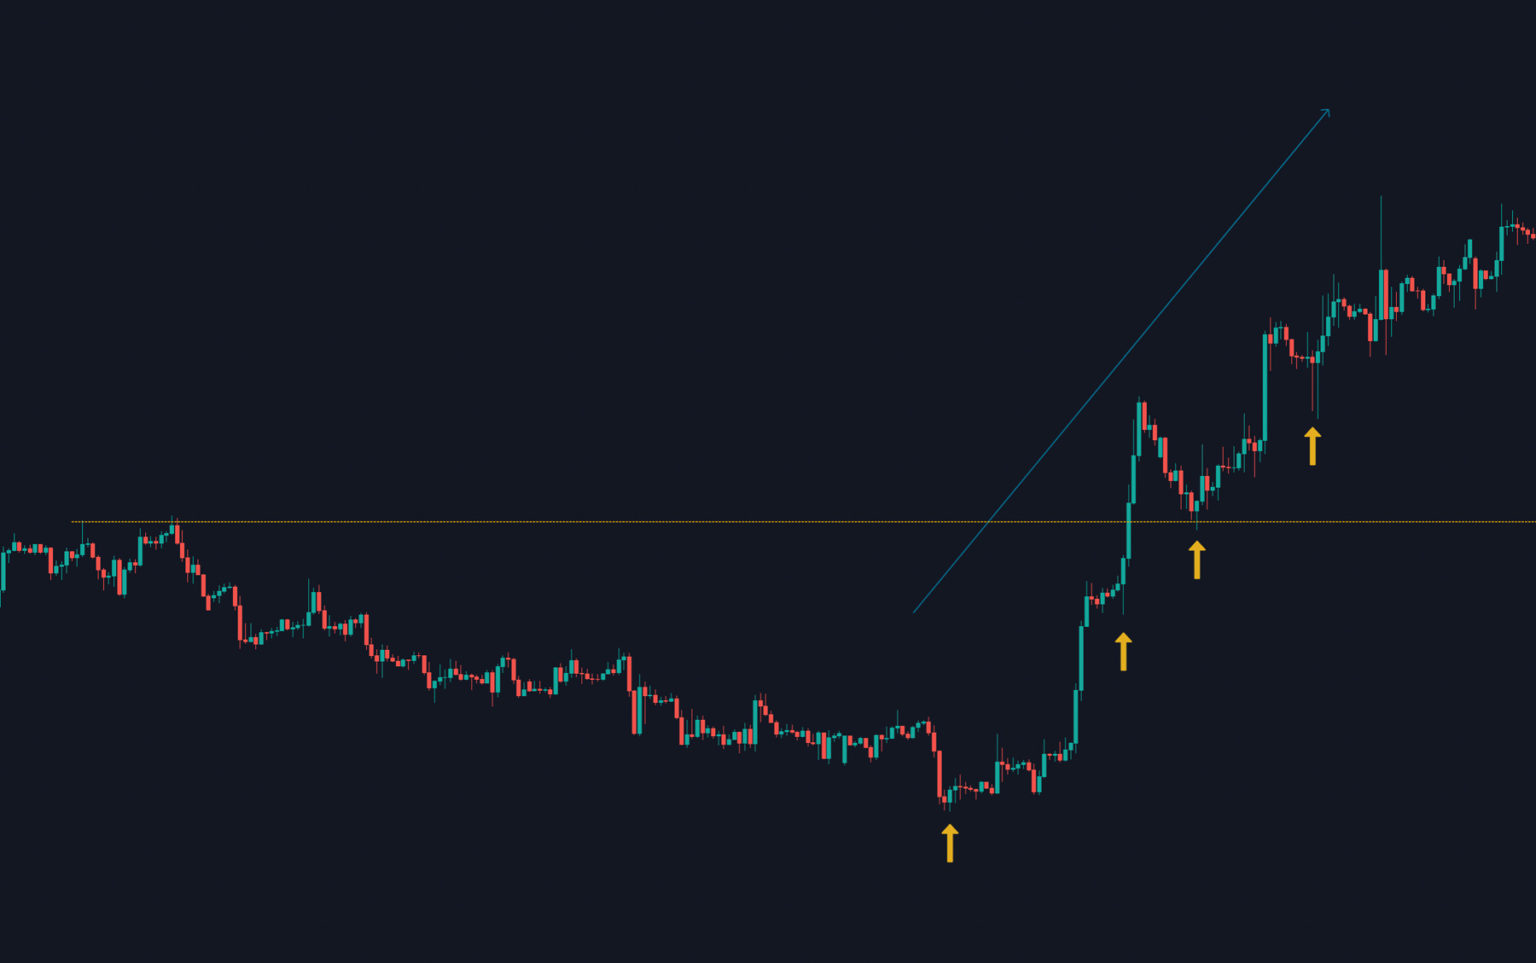
Pinbars can also appear two times in a row. This is even stronger, because it tells us ,that the market was driven to the lows or highs multiple times and got rejected. Even more market participants will then decide that it is valid support or resistance.
There are many different kinds of Pinbars. What we are looking for are clear signals, usually with a long tail (also called: wick) or a close much higher than the open price. The longer the tail the better.
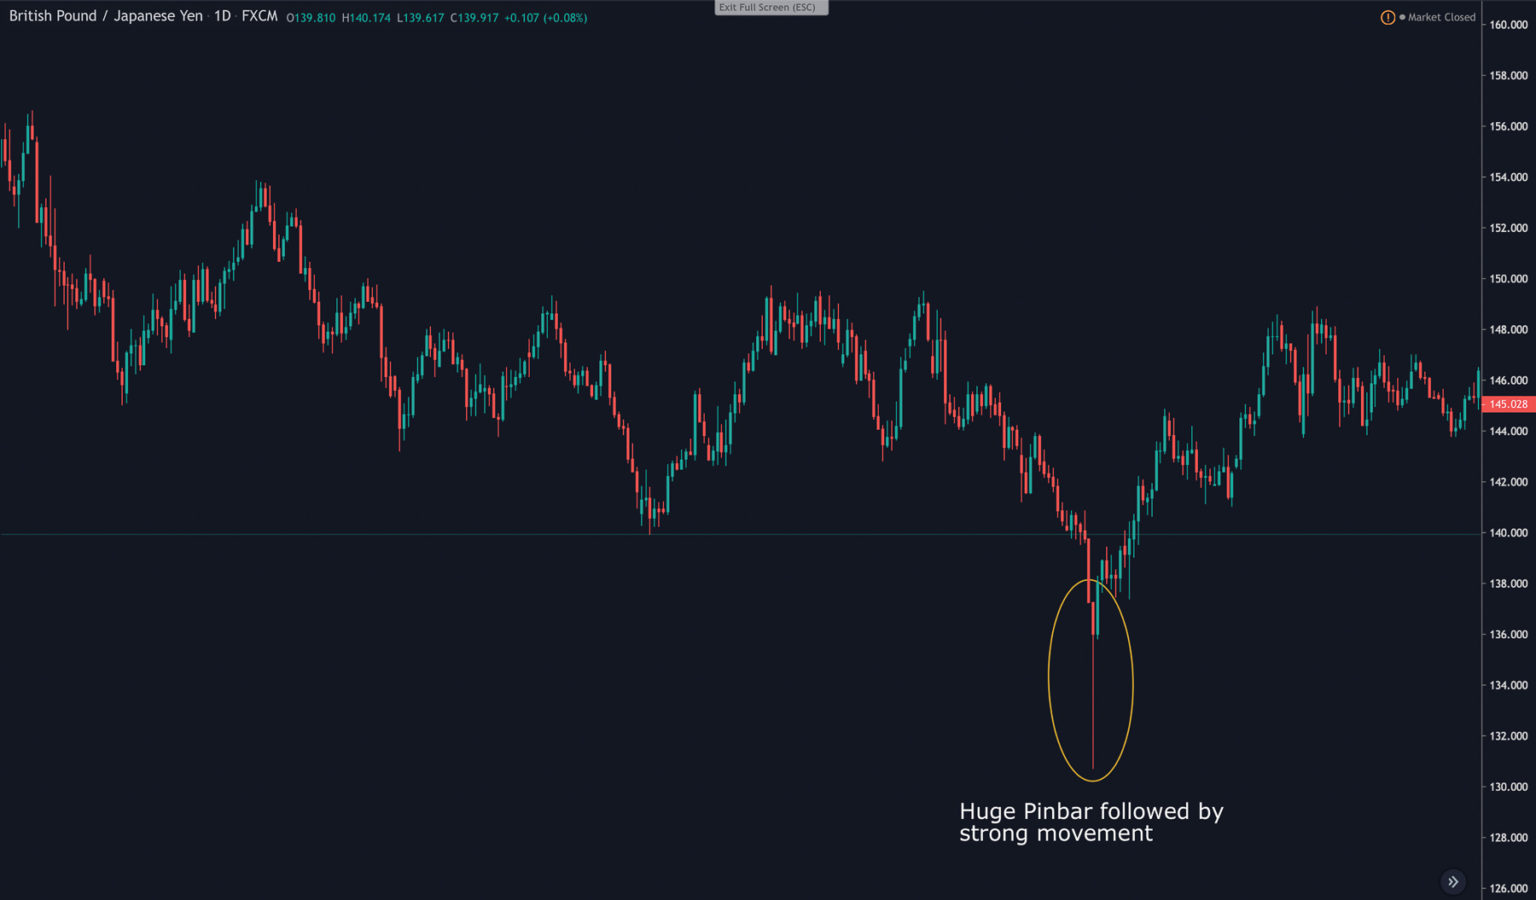
Have a look at the next picture and you can clearly see the strong movement, which happened after the huge pinbar.
I will cover the Pinbar in a more detailed post, because it is a really reliable price action signal and candlestick pattern and will greatly improve your results when traded in the right way.
Double Bar / Engulfing bar Pattern
As you can see in the following picture, this pattern consists of two candles. We have a strong movement, with no or very little tail. This candle alone is considered a strong move. But the second candle is the important one. As you can see in the double bar pattern, all of the previous move has been diminished. The engulfing bar pattern is even stronger, because the second period had an even lower close that the pervious open.
Psychology behind price movements
When looking at the underlying psychology of this market behavior we can see, that the market movers bought the asset. But it was not sustainable and all the gains were given back a little later. Maybe they took profit of their long positions or tricked the small investor into believing that the market will rise again.
When taking profit of a long position, a short position has to be opened to even out the long. In addition to this short interest in the market, the typical private trader took a long position and placed his stop just below the last low. Which is taught in every technical analysis textbook.
When the selling interest of the profit taking and additional sells of the stops come together, we will usually see a strong drop, with almost no retracement. (At this point we did not even consider, that the smart money will open short positions).
The double bar /engulfing bar pattern is very reliable, because it represents an even longer time period and therefore more information and opinions of all the traders. Like the pinbars, the size of the double bar pattern makes an impact on the significance. Big moves like this often happen on news event, where price goes strongly in one direction, before exploding in the opposite. Ergo we get a very powerful price action signal.
Morning Star /Evening Star Pattern
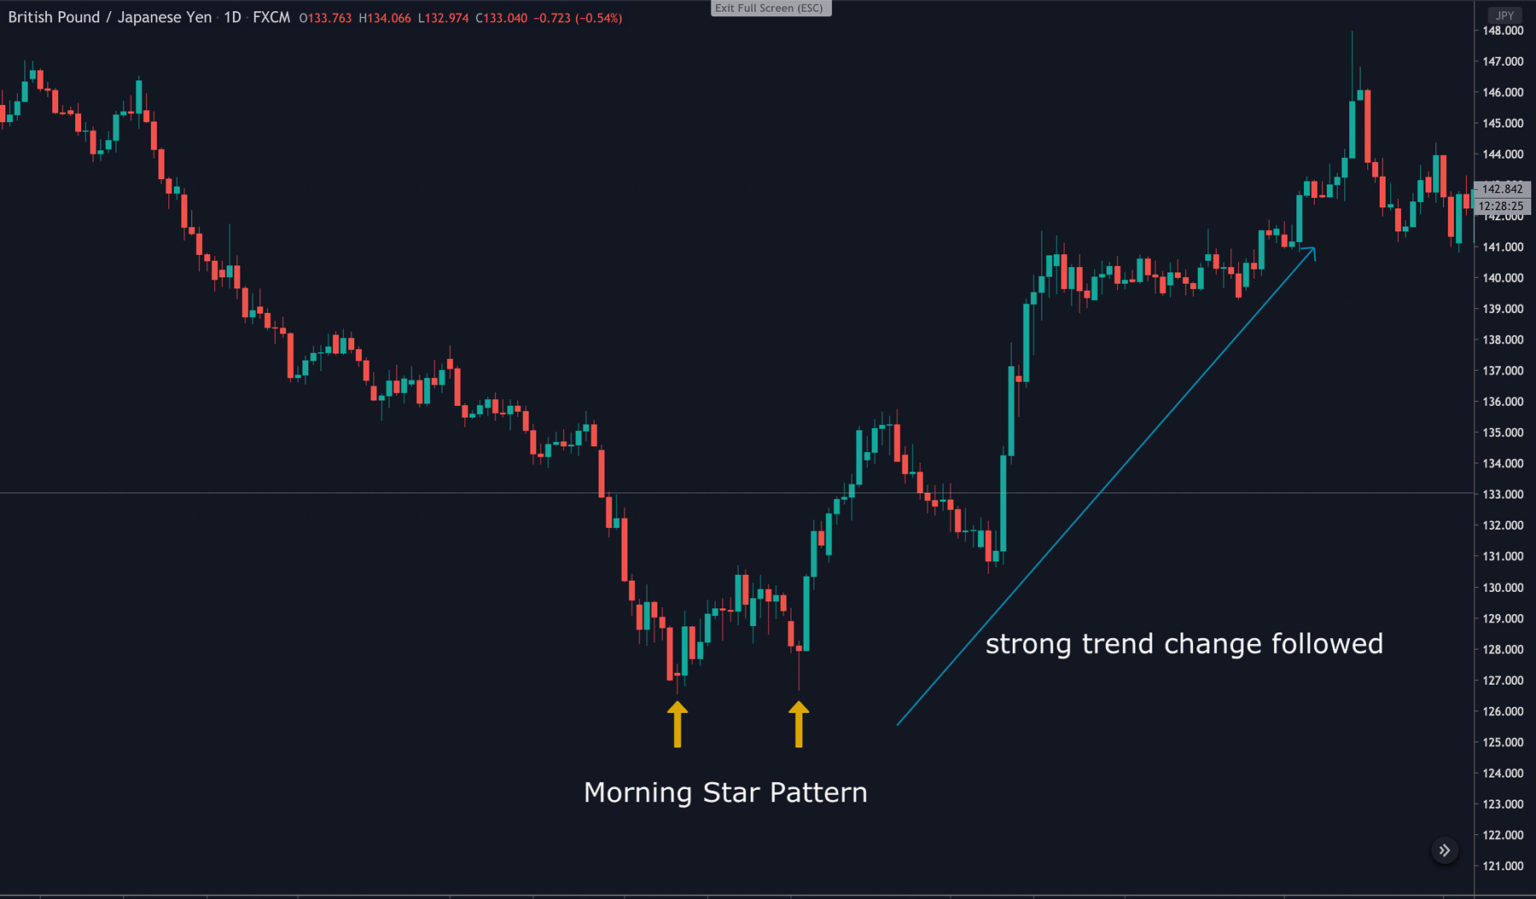
Similar to the double bar /engulfing bar pattern is the famous morning or evening star pattern. It consists usually of 3 bars. As you can see in the picture below we can spot a strong movement to the downside (Morning star). Then we have a doji candle, followed by a strong bullish candle.
As posted above, the underlying psychology and behavior of the market participants is what can be read in the candlestick formation.
First the asset was sold strongly, but came to a sudden stop because of the indecision in the market. In the next period the asset was strongly bought. This move tells us, that the previous selling pressure was not sustainable and the smart money thought the asset is worth more.
The Fakeout or Fakey Pattern
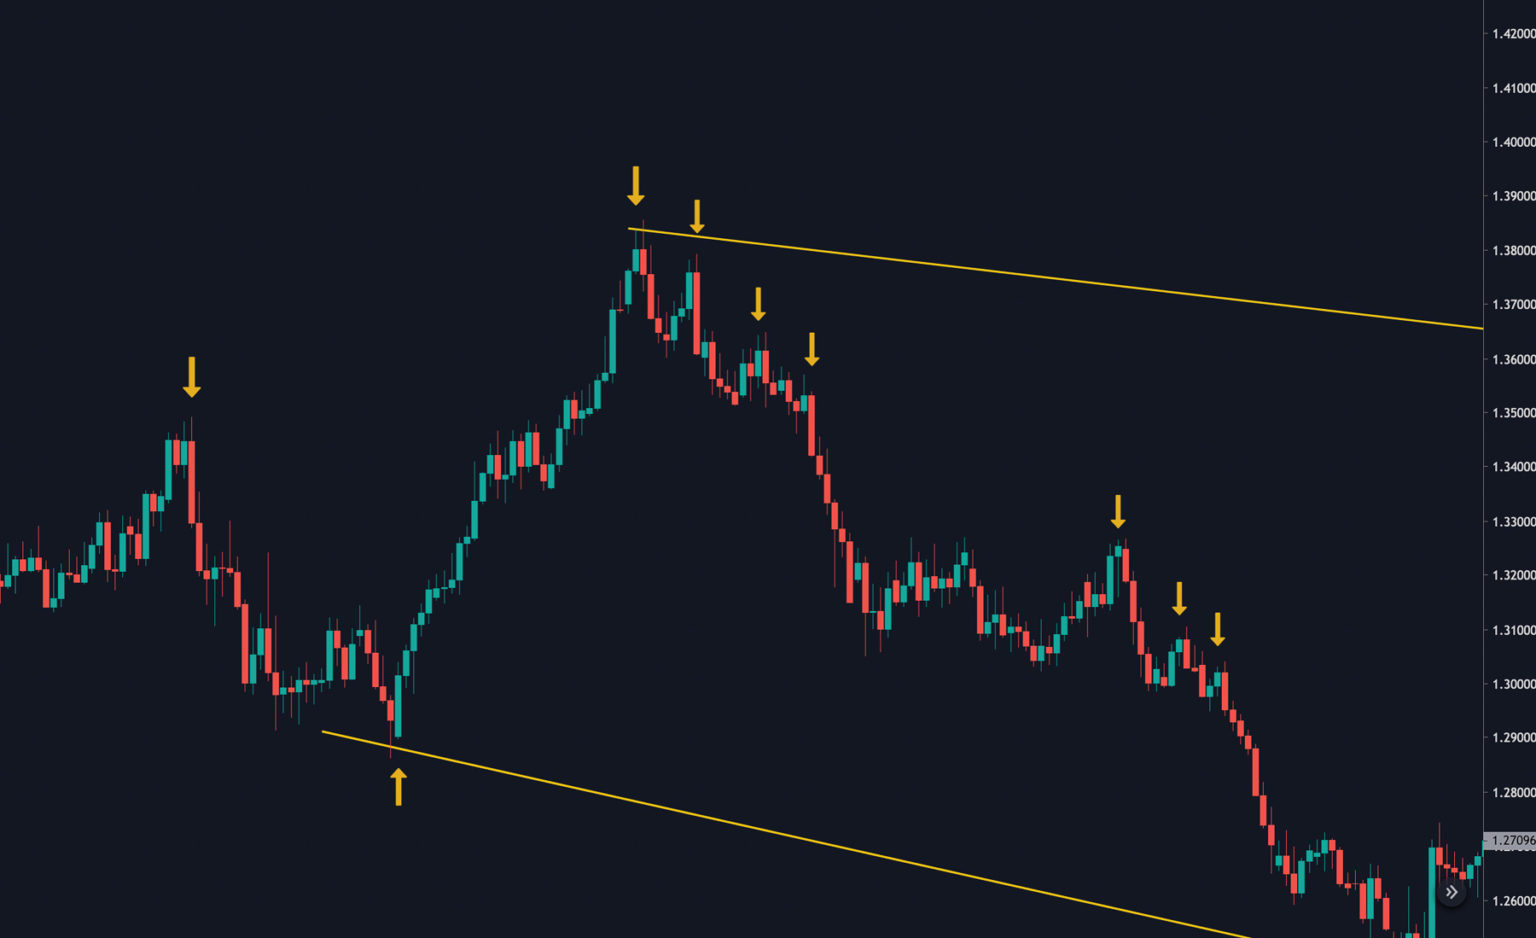
One of the most powerful candlestick pattern is the Fakeout or Fakey setup. It is best described as a fake breakout of inside bars to one side of the market before quickly recovering and shooting in the opposite direction.
You can see in the next picture a nice example of such a setup. First we have an outside or mother bar, followed by several inside bars. These inside bars represent the indecision in the market. What happens next is a breakout of the inside bars.
There is where stops of long retail traders are run and breakout trader began to open their position. After this initial breakout the big player come into the market and push the price higher. Catching the most traders on the wrong side and triggering the stop losses of the breakout traders.
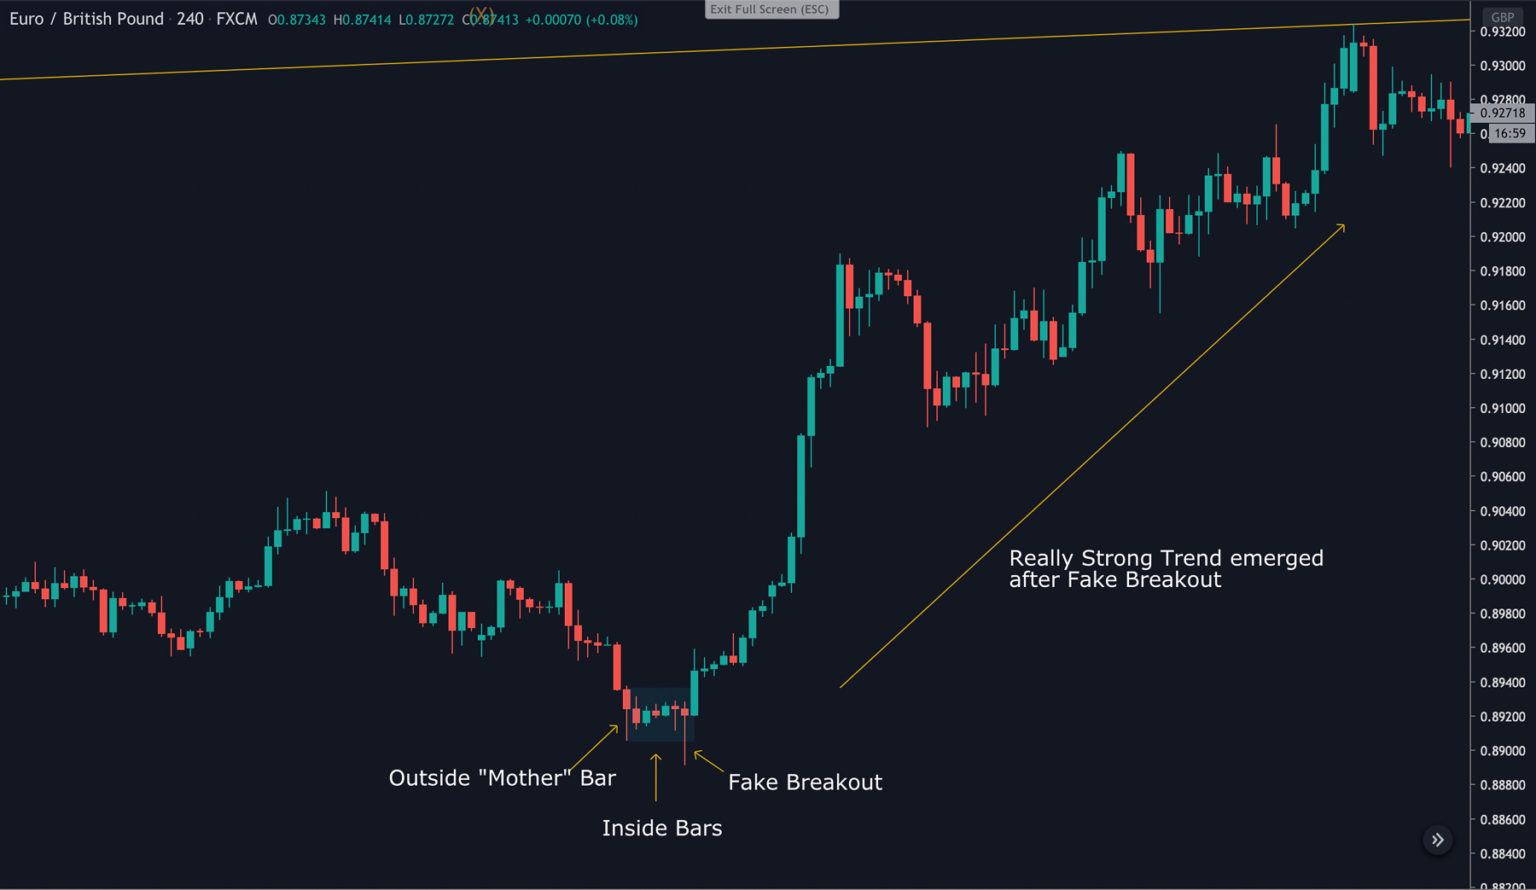
We then have much more buying pressure in the market and the price start to rise. Fakeout pattern can happen in combination with a Pinbar or a double bar pattern.
A Fakeout pattern represents a reversal in the market and often occurs at significant areas like a double top.
The fake breakout is one of my very favorite price action signals, it is very powerful and often has a small SL, which greatly improves your risk to reward.
Timeframe matters!
As you have probably already noticed, these pattern occur pretty often in the market. Especially on lower timeframes we can spot them easily, tricking us into believing they are significant. As you can read in my previous article about timeframes and why they matter, a signal with is formed on the daily or weekly chart, carries the opinion of many more traders in them. Therefore they are more significant than their 5 minute equivalent.
Of course on a higher timeframe, these reliable price action signals do not occur all the time, but your target is not to be trading all the time, but to execute your trades with precision and well thought planning.
Interweaved price
Another thing to mention about timeframes is, that some candlesticks formations form a different formation depending on the timeframe.
This phenomenon comes down to the interweaved nature of displaying price movement on charts.

Keep this in mind, because other traders act on various timeframes and get the same or different signals than you are.
It is important to understand, that when trading the markets you always want to anticipate a future movement. So when getting into a trade, you have to think about the other market movers. Some have either a long contract, are short and have a Stop loss (with represents a buy order to even out the already existing short position) or are currently flat and wait for more confirmation to enter a trade.
Always ask yourself, where do other market participants have to act? Where could a strong move occur?
Overall market structure
But not only is the size of a candlestick signal important, but also its overall position in the market structure. A candlestick which is out of context, does not provide a reliable trading signal. It often leads to premature entries, which often have their origin in Fear of missing out (FOMO).
What we are looking for is a candlestick with fits in the overall structure of support and resistance. When we have multiple factors lined up, the odds of a winning trade greatly increase. In the end, trading, like professional gambling, is a game of probability. So when factors like a clear trend, a nice support or resistance area and a clear and obvious candlestick pattern come together it is time to pull the trigger.
Conclusion
When trading price action, always ask yourself, where could a strong move occur? Where does a candlestick pattern fit into the overall market structure? Try to understand the behavior of the combined opinions and beliefs of the other market participants and where they have to act by opening, closing or even reversing their position. The professionals know where the private daytrader place their stops and often drives the price there to grab the liquidity.
Try to master one signal at the time, be patient and scan the market for significant moves. Don’t try to take every small pattern, especially on the lower timeframes. Soon you will master all of these powerful price action signals!